Nationwide Situation
Tested Positive
Data source: EODY. On March 28th, all flights to and from Germany and the Netherlands, excluding flights from Germany to Athens were suspended. On June 1st international flights to and from Athens International Airport resumed for EU+ countries, excluding flights between Greece and Italy, Spain, Sweden, the United Kingdom, and the Netherlands. On June 15th international flights between Greece and Albania, Italy, North Macedonia, Spain, and the Netherlands were resumed, international flights to and from Thessaloniki Airport Makedonia were resumed. Also borders with Bulgaria reopened for non-essential travel. On July 1st international flights between Greece and Algeria, Australia, Canada, Georgia, Japan, Montenegro, Morocco, New Zealand, Rwanda, Serbia, South Korea, Thailand, Tunisia, and Uruguay were resumed. Also international travel by sea between Italy and Patras and Igoumenitsa ports werer resumed. On July 15th borders were opened to Serbian citizens, international flights between Greece and the United Kingdom were resumed. On July 20th international flights between Greece and Sweden resumed. On August 15th international flights between Greece and Albania, North Macedonia, and Turkey resumed. On September 14th schools reopened. On November 7th the 2nd Lockdown began across the country. On May 14th curfew between 00:30 - 05:00, travel restrictions lifted. On June 28th people are only obligated to wear masks in crowded spaces (indoors or outdoors). See notes below for further information. On April 6th 2022 virus reinfections were also added to the daily report. The total number (up until the 5th of April) is estimated at 118,070 reinfections.READ MORE
Critically Ill
Data source: EODY. See notes below for further information.
Vaccinations
Data Source: data.gov.gr. (Our data is collated and updated every day after 9pm) READ MORE
Discharge/Admissions of Patients
Data Source: covid19.gov.gr (The daily changes reported by EODY concern cases of the previous day). On December 16th, 2021, covid19.gov.gr stopped reporting the daily Discharges of patients. READ MORE
ICU/Beds coverage
Data Source: covid19.gov.gr (The daily changes reported by EODY concern cases of the previous day) READ MORE
Age distribution of confirmed cases
Percentage distribution (total)
Percentage distribution (men)
Percentage distribution (women)
Cases by gender (total)
Deaths by gender (total)
Critically Ill by gender (total)
Vaccination Uptake
Predictions
Effective Reproduction Number R_j (estimate)
A likelihood-based estimation procedure that infers the temporal pattern of effective reproduction numbers from an observed epidemic curve. The shown epidemic curve comprises all captured cases assigned to their estimated symptom onset date. Formula uses: Based on the selected data an offset average
Positivity Rate
The positivity rate is given with a rolling 7-day average, except in the case of 'Daily PCR+Rapid' which is expressed based on daily values. See notes below for further information. READ MORE
Implied Infection Fatality Rate (IIFR)
Using the estimates of true infections we can compute the implied infection fatality rate (IIFR), by taking the reported deaths from 28 days into the future (7-day moving average) and dividing it by the true infections (7-day moving average). Note that we assume that reported deaths is roughly equal to true deaths. If there is a significant amount of excess/unreported COVID-19 deaths, then our IIFR estimate will be an underestimate of the true IFR.It is not age-adjusted. As a result, if there is an increasing prevalence of the disease in a younger population, then the IFR will decrease, despite the deadliness of the virus remaining unchanged among a particular age group. See notes below for further information. covid19-projections.com for all assumptions made. READ MORE
Active Cases (estimate)
Formula: Translate reported cases by adding all the cumulative tested positive cases that existed from 8 days ago (Most people recover from mild COVID-19 within 5 days and more serious disease within 11 days, giving a absolute median of 11). Some smoothing has also been applied due to some cases being from tourists that tested positive at the borders. See notes below for further information. READ MORE
«True» number of infections (estimate)
The core idea behind this method is that we can use the positivity rate to roughly determine the ratio of true infections to reported cases. The hypothesis is that as positivity rate increases, the higher the true prevalence in a region relative to the reported cases. Note that all values used are 7-day moving averages. See notes below or further information. covid19-projections.com for all assumptions made. READ MORE
Prefectures
Each Prefecture
Deaths in
Google Mobility indexes
Source: Google mobility report.
Unemployment
Data source: dypa.gov.gr.
Per Prefecture
| Prefectures (click for more) | 14-day trend of COVID (mov.avg) |
New cases last 14 days (mov.avg) |
Confirmed | Cases per 100K p. (7-Day mov.avg) |
Positivity |
Rj Index | Vaccinations | Vaccinations last 14 days (mov.avg) |
% of vacc. Regional Unit |
% of vacc. Regional Unit |
% of vacc. Regional Unit |
% of vacc. Residents |
% of vacc. Residents |
Population |
|---|
Daily incidence map
(14-Day Mov. Average)
Resources: EODY. Measures by Covid-19-Response-Greece. Data on prefectures were taken from EODY, covid19.gov.gr. (Special thanks to @Nyrro for the initial data). Data on the vaccinations by age groups were taken from ECDC. Predictions were taken from covid19-projections.com, covid19.healthdata.org. Used introductory text for IIFR from WHO and prediction model from (link1, link2, link3).
Effective Reproduction number RJ algorithm taken from American Journal of Epidemiology and Richard Schubert. Used Chart.js and highcharts to draw the charts.
Original template by: TOYO KEIZAI ONLINE
Frequently Asked Questions
Q. Why do some values reported by EODY don't coincide with the values on the graphs?
A. This usually happens when yesterday's daily report contains errors or some values need to be updated. These changes occur in the next daily report.
Q. Why do some values show a negative value, even though they shouldn't ?
A. It happens when the previous data have been corrected or there are no available data on the next day. When previous numbers contain errors, any corrections to the final values are made in the next daily report. The above does not apply in the cases of "Critically Ill" section. Negative values in this section means a patient has either left the intensive or sadly has died.
Q. What is the definition of "Critically Ill"?
A. It means cases where the patient is provided with respiratory support. (intubation)
Q. How accurate is the Active Cases section?
A. It is only an estimate based on the assumption that most people recover from a mild form of COVID-19 within two (Delta) one week and in the most severe cases within three (Delta) two weeks (average), giving an absolute median of 17 (Delta) 8 days. Subtracting the number of cases that were found positive when entering the country as well as the number of deaths per day from the total number of daily cases we find the average number of active cases per day. To give an example (Delta), the sum of all cases from 17 days before the 7th of August was 1222. We also had 13 deaths and a total of 261 cases related to travel from abroad. Subtracting the above 2 values from the total number of cases we have (approximately) 896 active cases.
It is worth noting that when this graph reaches zero we can not assume that the epidemic has stopped due to the stochastic nature of the data. However, a rise of the graph after a decline can indicate that a second wave is coming.
Q. What is Effective Reproduction Number Rj?
Often, estimation of the effective reproduction number is a complicated affair, because only the epidemic curve is observed and there is no information about who infected whom. Recent analyses of closely monitored epidemics have shown that it is possible to estimate the probability that one person has infected another if the spatial locations of the infected persons are available. However, when only times of symptom onset are available, most investigators resort to approximating 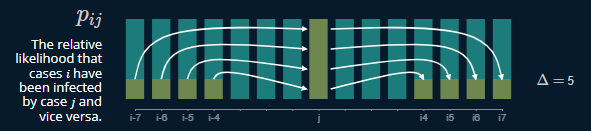 The estimation algorithm allows estimation of the effective reproduction numbers for infectious diseases at a finer temporal resolution under more general assumptions than was previously possible.
Q. How is the «True» number of infections been produced?
Knowing the true number of people who are infected with COVID-19 is an essential step towards understanding the disease. But estimating this number is not a simple task. The true number of infections is many times greater than the reported number of cases because the majority of infected individuals do not get tested due to several reasons: 1) they are asymptomatic, 2) they are only mildly symptomatic, 3) they do not have easy access to testing, or 4) they simply do not want to.
The core idea behind this method is that we can use the positivity rate to roughly determine the ratio of true infections to reported cases. The hypothesis is that as positivity rate increases, the higher the true prevalence in a region relative to the reported cases. This also makes sense intuitively: if you test everyone, then the positvity rate will be very low, and you will catch every case. But if testing is not widely available, then you will catch only the severe cases, resulting in a higher positivity rate. This phenomenon is sometimes referred to as preferential testing. The exact relationship varies from region to region and across time. But if one were to take the average across all of the data, one can generate a theoretical curve. This relationship can be approximated by a root function of the following form: prevalenceRatio = a * (positivityRate)^(b) + c, where
Q. What is the positivity rate?
A. The positive rate is just the fraction of the tests that come back positive. It is calculated by dividing the number of positive confirmed cases by the total number of tests performed. A 7-day moving average is used in all of our calculations, so the same applies here.
Q. What is the Implied Infection Fatality Rate (IIFR)?
A. An important characteristic of an infectious disease, particularly one caused by a novel pathogen like SARS-CoV-2, is its severity, the ultimate measure of which is its ability to cause death. Fatality rates help us understand the severity of a disease, identify at-risk populations, and evaluate quality of healthcare. There are two measures used to assess the proportion of infected individuals with fatal outcomes. The first is infection fatality ratio (IFR), which estimates this proportion of deaths among all infected individuals. The second is case fatality ratio (CFR), which estimates this proportion of deaths among identified confirmed cases. To measure IFR accurately, a complete picture of the number of infections and deaths caused by the diseasem must be known. Consequently, at this early stage of the pandemic, most estimates of fatality ratios have been based on cases detected through surveillance and calculated using crude methods, giving rise to widely variable estimates of CFR by country – from less than 0.1% to over 25%. For COVID-19, as for many infectious diseases, the true level of transmission is frequently underestimated because a substantial proportion of people with the infection are undetected either because they are asymptomatic or have only mild symptoms and thus typically fail to present at healthcare facilities. Since a complete picture of the number of infections and deaths is not yet possible, as the pandemic is still ongoing, we can express all of the above in an equation using the values of the "true" number of infections and reported deaths. Although this is by no means a complete equation, at least in this way we approach (within a reasonable framework) a value that helps us to better understand the changing dynamics of this disease and its impact on the population.
The IIFR is a metric derived by taking the reported deaths and dividing them by the true infections estimate (after accounting for lag, 28 days delay). Note that we assume that the reported deaths are approximately equal to the actual deaths. If there is a significant number of exaggerated / unreported COVID-19 deaths, then the IIFR estimate will be lower than the actual IFR. For all values, a 7-day average was used.
- Lower median age of infection
- Better protection of vulnerable populations
- Improved treatment (new drugs, better allocation of resources, more experience among staff, etc)
- Earlier detection
The above are explanations that would explain a true decrease in IFR. A lower median age of infection and better protection of high-risk populations are probably the primary drivers behind the decrease in IIFR. Below are some reasons that could skew the IIFR lower, but not change the true IFR:
- More comprehensive reporting of confirmed cases
- Changes in the distribution of age groups tested (e.g. more younger people getting tested would skew IIFR down)
- Inflation of the test positivity rate (e.g. double-counting positives, not reporting negatives, etc)
- Longer lag in death reporting
- Underreporting of deaths
Q. Can I use the data?
A. Yes, feel free to use it for both commercial or non-commercial use. If you'd like just mention my name Sandbird. Other specific standards are based on the MIT license and our Privacy Policy .